A basic pipeline
This example shows a basic pipeline that reads some frames of a video and writes them in an output video.
[1]:
%load_ext autoreload
%autoreload 2
For this example we will create a pipeline with only two components: - A source that reads from a video file. - A sink that writes to a video file.
[2]:
from videoanalytics.pipeline import Pipeline
from videoanalytics.pipeline.sources import VideoReader
from videoanalytics.pipeline.sinks import VideoWriter
Note: the video used in this example was downloaded from youtube.
[3]:
DATA_PATH = "../data"

# Input
INPUT_VIDEO = DATA_PATH+"/input/test_video.mp4"
START_FRAME = 0
MAX_FRAMES = 100
[4]:
%%HTML
<div style="text-align: center">
    <video width="600" height="400" controls>
      <source src="../data/input/test_video.mp4" type="video/mp4">
    </video>
</div>
Path for output video.
[5]:
OUTPUT_VIDEO = DATA_PATH+ "/output/test_output.avi"
Typical workflow
The following steps illustrate the typical workflow for definining and executing a pipeline.
Step 1. Create the global context used by components to share data.
[6]:
context = {}
Step 2. Create the pipeline and add each component.
[7]:
pipeline = Pipeline()
[8]:
pipeline.add_component( VideoReader( "input",context,
                 video_path=INPUT_VIDEO,
                 start_frame=START_FRAME,
                 max_frames=MAX_FRAMES))
[9]:
pipeline.add_component(VideoWriter("writer",context,filename=OUTPUT_VIDEO))
Step 3. Define the order of execution. Each tuple (A,B) indicates that B has to be executed after A.
[10]:
pipeline.set_connections([
    ("input", "writer")
])
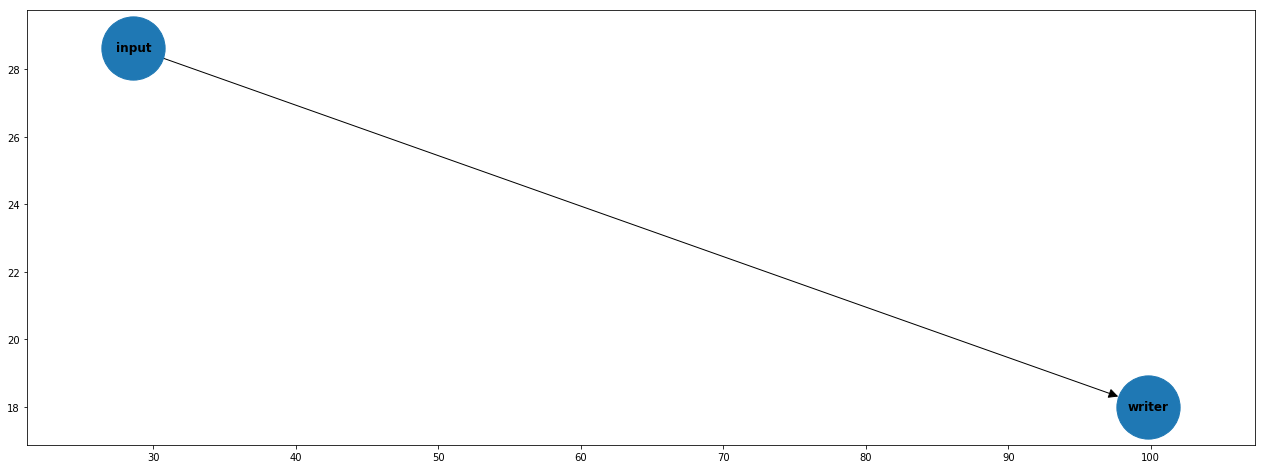
Step 4 (optional). Remove isolated components and plot the graph.
[11]:
pipeline.optimize()
[12]:
import matplotlib.pyplot as plt

fig,axes = plt.subplots(1,1,figsize=(22,8))
pipeline.plot(ax=axes)
Step 5. Execute the pipeline.
[13]:
pipeline.execute()
print("Total execution time [s]:", pipeline.get_total_execution_time())
Total execution time [s]: 2.886986176999926
Step 6 (optional). Report the execution times for each component. Times are expressed in seconds.
[14]:
import pandas as pd

metrics_df = pd.DataFrame.from_dict(pipeline.get_metrics(), orient='index',columns=["time"])
metrics_df
[14]:
| time | |
|---|---|
| input_avg_dt | 0.006297 |
| writer_avg_dt | 0.022153 |
Display the output video.
Note: currently XVID format is not supported by jupyter.
[15]:
%%HTML
<div style="text-align: center">
    <video width="600" height="400" controls>
      <source src="../data/output/test_output.avi" type="video/avi">
    </video>
</div>