Events and statistics from ROIs
This example illustrates the usage of regions of interest (ROIs) to capture statistics and interesting events from footage, under the assumption that the camera has a fixed position and orientation.
Contents:
Loading and displaying ROIs.
Counting objects inside ROIs.
Triggering interesting events.
[1]:
%load_ext autoreload
%autoreload 2
[65]:
from videoanalytics.pipeline import Pipeline
from videoanalytics.pipeline.sources import VideoReader
from videoanalytics.pipeline.sinks import VideoWriter, VariableCSVWriter
Loading and displaying ROIs
Configuration
Input and output video
We will be using the same video as in the previous examples. Note: the video used in this example was downloaded from youtube.
[118]:
DATA_PATH = "../data/"

# Input
INPUT_VIDEO = DATA_PATH+"/input/test_video.mp4"
START_FRAME = 0
MAX_FRAMES = 1000
[4]:
%%HTML
<div style="text-align: center">
    <video width="600" height="400" controls>
      <source src="../data/input/test_video.mp4" type="video/mp4">
    </video>
</div>
[6]:
# Output
OUTPUT_VIDEO = DATA_PATH+ "/output/test_output.avi"
Definition of ROIs
[7]:
ROI_DEFINITION_FILE= DATA_PATH+"/roi/mirtar.json"
!cat {ROI_DEFINITION_FILE}
{
        "regions": [
                {
                        "name": "upper_left",
                        "polygon": [[385, 315], [676, 334], [754, 625], [668, 810], [165, 757]],
                        "color": [155,155,0]
                },

                {
                        "name": "lower_left",
                        "polygon": [[11, 532], [777, 606], [666, 1073], [5, 1074]],
                        "color": [155,155,0]
                },

                {
                        "name": "upper_right",
                        "polygon": [[1057, 336], [908, 682], [954, 773], [1522, 754], [1565, 595], [1210, 305]],
                        "color": [155,0,155]
                },

                {
                        "name": "lower_right",
                        "polygon": [[973, 1072], [949, 625], [1749, 538], [1904, 1068]],
                        "color": [155,0,155]
                },


                {
                        "name": "winch",
                        "polygon": [[1088, 369], [592, 382], [570, 580], [1131, 584]],
                        "color": [0,255,0]
                }
        ]
}
Pipeline instantiation and execution
[8]:
from videoanalytics.pipeline.sinks.roi import ROIView
[9]:
# 1. Create the global context
context = {}

# 2. Create the pipeline
pipeline = Pipeline()

# 3. Add components

# 3.1 Source
pipeline.add_component( VideoReader( "input",context,
                 video_path=INPUT_VIDEO,
                 start_frame=START_FRAME,
                 max_frames=MAX_FRAMES))
[10]:
# 3.2 ROI viewer
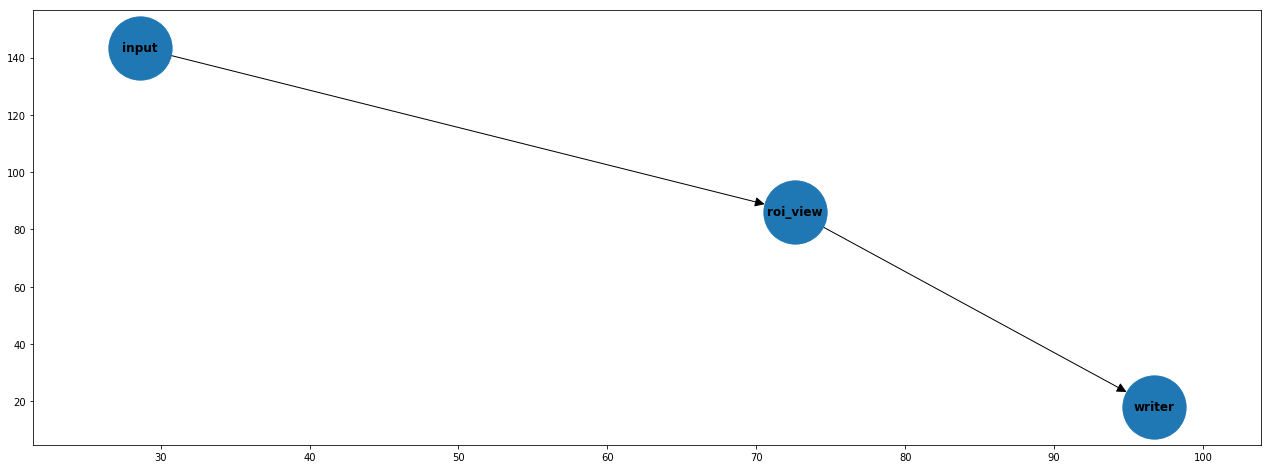
pipeline.add_component( ROIView("roi_view",context,filename=ROI_DEFINITION_FILE,alpha=0.6 ) )
[11]:
# 3.3 Sink
pipeline.add_component(VideoWriter("writer",context,filename=OUTPUT_VIDEO))
[12]:
# 4. Define connections
pipeline.set_connections([
    ("input", "roi_view"),
    ("roi_view", "writer")
])
[13]:
import matplotlib.pyplot as plt

fig,axes = plt.subplots(1,1,figsize=(22,8))
pipeline.plot(ax=axes)
[14]:
# 5. Execute
pipeline.execute()
print("Total execution time [s]:", pipeline.get_total_execution_time())
Total execution time [s]: 30.61876826400112
[ ]:
import pandas as pd

# 6. Report (optional)
metrics_df = pd.DataFrame.from_dict(pipeline.get_metrics(), orient='index',columns=["time [s]"])
metrics_df
Exploration of results
Display the output video with annotated ROIs.
Note: currently XVID format is not supported by jupyter.
[54]:
%%HTML
<div style="text-align: center">
    <video width="600" height="400" controls>
      <source src="../data/output/test_output.avi" type="video/mp4">
    </video>
</div>
A pipeline for counting objects inside ROIs
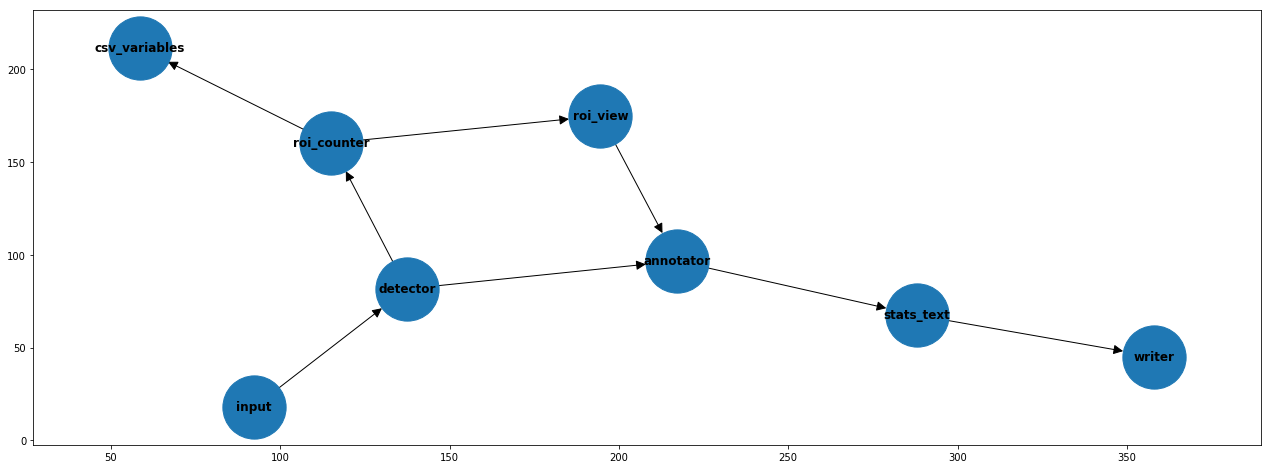
A more real and useful application is to obtain statistics (object count, activity, etc.) to associate the activity in each ROI to interesting patterns in the footage. The following example counts the total instances for each ROI. Note that certain areas indicate that a particular acitvity is being performed, such as rising the networks or classifying the catch from the deck.
[16]:
from videoanalytics.pipeline.sinks.roi import ROIPresenceCounter
from videoanalytics.pipeline.sinks.visualization import TextOverlay
[18]:
# Specific components for object detection
from videoanalytics.pipeline.sinks.object_detection import DetectionsAnnotator, DetectionsCSVWriter
from videoanalytics.pipeline.sinks.object_detection.yolo4 import YOLOv4DetectorTF
[30]:
# Detector

# Object Detector model weights (Tensorflow)
DETECTOR_WEIGHTS_FILENAME = DATA_PATH+ "object_detection/checkpoints/yolov4-416-tf"
#DETECTOR_WEIGHTS_FILENAME = DATA_PATH+ "object_detection/checkpoints/yolov4-tiny-416"


# Classes names for Detections Annotator
DETECTOR_CLASSES_FILENAME = DATA_PATH+"object_detection/classes_definitions/coco.txt"

# CSV with Detections filename
DETECTIONS_FILENAME = DATA_PATH+"/output/detections.csv"

# CSV with variables
VARIABLES_FILENAME = DATA_PATH+"/output/variables.csv"
Pipeline instantiation and execution
[56]:
# 1. Create the global context
context = {}

# 2. Create the pipeline
pipeline = Pipeline()

# 3. Add components

# 3.1 Source
pipeline.add_component( VideoReader( "input",context,
                 video_path=INPUT_VIDEO,
                 start_frame=START_FRAME,
                 max_frames=MAX_FRAMES))

# 3.2 Detector
pipeline.add_component( YOLOv4DetectorTF("detector",context,weights_filename=DETECTOR_WEIGHTS_FILENAME) )


# 3.3 Annotate detections in output video
pipeline.add_component( DetectionsAnnotator("annotator",context,
                                             class_names_filename=DETECTOR_CLASSES_FILENAME,
                                             show_label=True) )

# 3.4 ROI viewer
pipeline.add_component( ROIView("roi_view",context,filename=ROI_DEFINITION_FILE,alpha=0.6 ) )

# 3.5 ROI object counter
pipeline.add_component( ROIPresenceCounter("roi_counter",context,filename=ROI_DEFINITION_FILE) )

# 3.5 Display variables on display
pipeline.add_component( TextOverlay("stats_text",context,
                                    text="Upper left: {q_upper_left}\n"
                                         "Lower left: {q_lower_left}\n"
                                         "Upper right: {q_upper_right}\n"
                                         "Lower right: {q_lower_right}\n"
                                         "Winch: {q_winch}\n"
                                         "Total: {q_total}",
                                    x=10,y=40) )

# 3.6 Store variables in CSV
pipeline.add_component( VariableCSVWriter("csv_variables",context,filename=VARIABLES_FILENAME,
                                          variables_to_write=[
                                                "q_upper_left",
                                                "q_lower_left",
                                                "q_upper_right",
                                                "q_lower_right",
                                                "q_winch",
                                                "q_total"
                                          ]))


# 3.6 Sink
pipeline.add_component(VideoWriter("writer",context,filename=OUTPUT_VIDEO))

# 4. Define connections
pipeline.set_connections([
    ("input", "detector"),
    ("detector", "roi_counter"),
    ("detector", "annotator"),
    ("roi_counter", "roi_view"),
    ("roi_counter", "csv_variables"),
    ("roi_view", "annotator"),
    ("annotator", "stats_text"),
    ("stats_text", "writer")
])
[57]:
import matplotlib.pyplot as plt

fig,axes = plt.subplots(1,1,figsize=(22,8))
pipeline.plot(ax=axes)
[58]:
# 5. Execute
pipeline.execute()
print("Total execution time [s]:", pipeline.get_total_execution_time())
Total execution time [s]: 655.7459518609976
[ ]:
import pandas as pd

# 6. Report (optional)
metrics_df = pd.DataFrame.from_dict(pipeline.get_metrics(), orient='index',columns=["time [s]"])
metrics_df
Exploration of results
Display the output video with annotated bounding boxes.
Note: currently XVID format is not supported by jupyter.
[59]:
%%HTML
<div style="text-align: center">
    <video width="600" height="400" controls>
      <source src="../data/output/test_output.avi" type="video/mp4">
    </video>
</div>
Time series
[61]:
import pandas as pd
df = pd.read_csv(VARIABLES_FILENAME)

df.head(5)
[61]:
| frame_num | q_upper_left | q_lower_left | q_upper_right | q_lower_right | q_winch | q_total | |
|---|---|---|---|---|---|---|---|
| 0 | 10000 | 0 | 0 | 1 | 0 | 3 | 4 |
| 1 | 10001 | 0 | 0 | 1 | 0 | 3 | 4 |
| 2 | 10002 | 0 | 0 | 1 | 0 | 3 | 4 |
| 3 | 10003 | 0 | 0 | 0 | 0 | 3 | 3 |
| 4 | 10004 | 0 | 0 | 0 | 0 | 3 | 3 |
[63]:
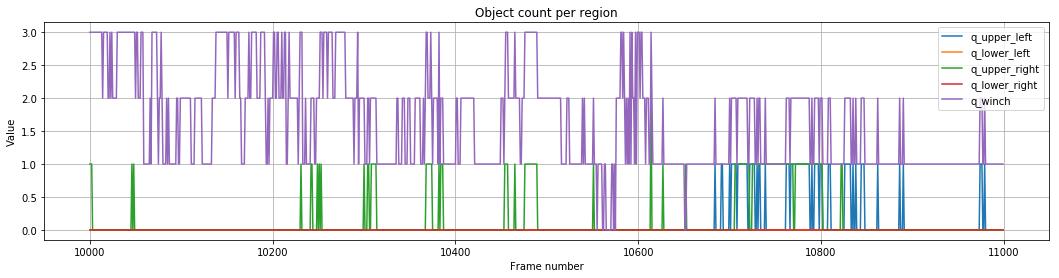
fig,axes = plt.subplots(1,1,figsize=(18,4))
axes.grid(True)

variables = [
    "q_upper_left",
    "q_lower_left",
    "q_upper_right",
    "q_lower_right",
    "q_winch"
]
for v in variables:
    axes.plot(df.frame_num,df[v])
axes.legend(variables)
axes.set_xlabel("Frame number")
axes.set_ylabel("Value")
axes.set_title("Object count per region");
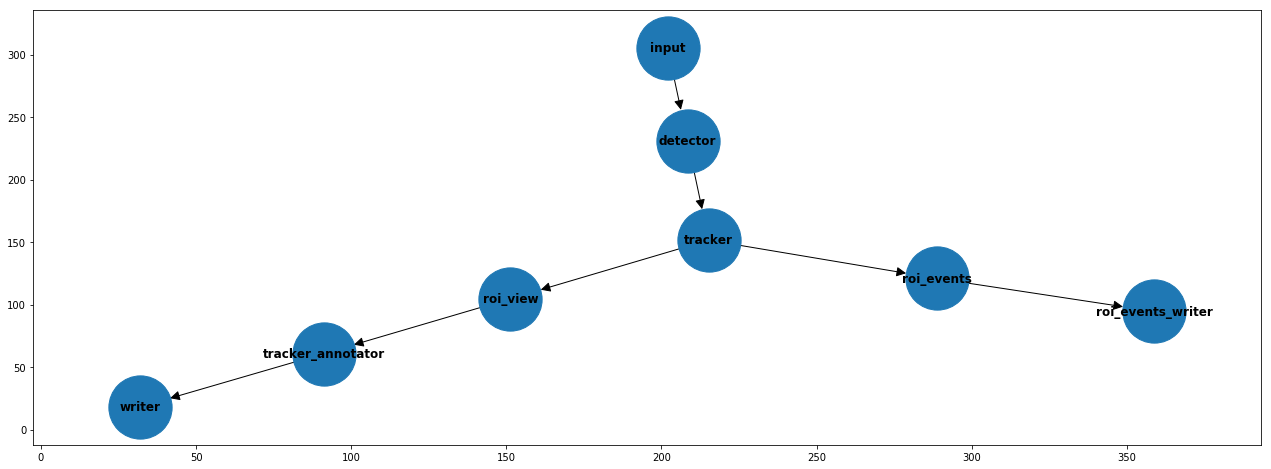
A pipeline for triggering events from ROI activity
[109]:
#FIXME
import json
from shapely.geometry import Point
from shapely.geometry.polygon import Polygon

from videoanalytics.pipeline.sinks.roi.events import ROIEvents, ROIEventsCSVWriter
Pipeline instantiation and execution
[67]:
DEEPSORT_MODEL_FILENAME = DATA_PATH+"object_tracking/mars-small128.pb"
[107]:
ROI_EVENTS_FILENAME = DATA_PATH+"/output/roi_events.csv"
[155]:
from videoanalytics.pipeline.sinks.object_tracking.deepsort import DeepSORT
from videoanalytics.pipeline.sinks.object_tracking import TrackedObjectsAnnotator, TrackedObjectsCSVWriter

# 1. Create the global context
context = {}

# 2. Create the pipeline
pipeline = Pipeline()

# 3. Add components

# 3.1 Source
pipeline.add_component( VideoReader( "input",context,
                 video_path=INPUT_VIDEO,
                 start_frame=START_FRAME,
                 max_frames=MAX_FRAMES))

# 3.2 Detector
pipeline.add_component( YOLOv4DetectorTF("detector",context,weights_filename=DETECTOR_WEIGHTS_FILENAME) )

# 3.3 ROI viewer
pipeline.add_component( ROIView("roi_view",context,filename=ROI_DEFINITION_FILE,alpha=0.6 ) )

# 3.4 Tracker (DeepSORT)
pipeline.add_component( DeepSORT("tracker",context,model_filename=DEEPSORT_MODEL_FILENAME) )
pipeline.add_component( TrackedObjectsAnnotator("tracker_annotator",context) )

# 3.5 Events generator
pipeline.add_component( ROIEvents("roi_events",context,filename=ROI_DEFINITION_FILE) )

# 3.6 Record events to CSV
pipeline.add_component( ROIEventsCSVWriter("roi_events_writer",context,ROI_EVENTS_FILENAME) )

# 3.7 Video Sink
pipeline.add_component(VideoWriter("writer",context,filename=OUTPUT_VIDEO))

# 4. Define connections
pipeline.set_connections([
    ("input", "detector"),
    ("detector", "tracker"),
    ("tracker", "roi_view"),
    ("roi_view", "tracker_annotator"),
    ("tracker", "roi_events"),
    ("roi_events", "roi_events_writer"),
    ("tracker_annotator", "writer")
])
[156]:
import matplotlib.pyplot as plt

fig,axes = plt.subplots(1,1,figsize=(22,8))
pipeline.plot(ax=axes)
[125]:
# 5. Execute
pipeline.execute()
print("Total execution time [s]:", pipeline.get_total_execution_time())
Total execution time [s]: 767.0963284800018
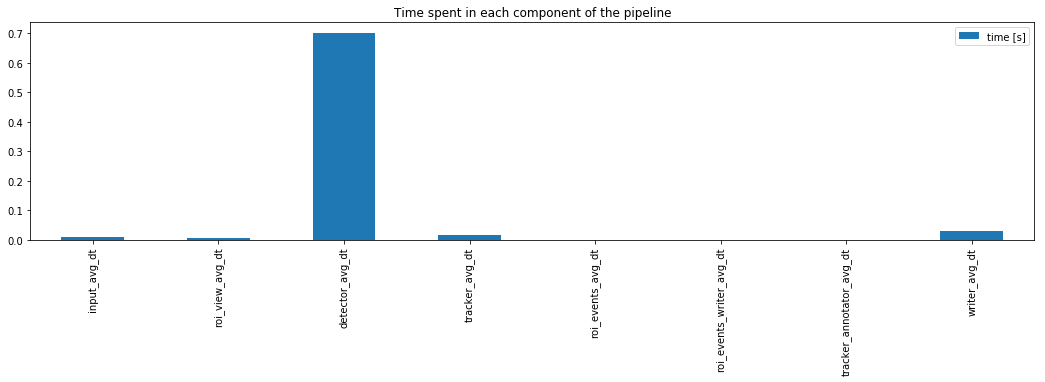
¿Is this approach suitable for online processing?
If the detector inference time could be optimized, this might be a suitable approach for an online application.
[126]:
import pandas as pd

# 6. Report (optional)
metrics_df = pd.DataFrame.from_dict(pipeline.get_metrics(), orient='index',columns=["time [s]"])
metrics_df
[126]:
| time [s] | |
|---|---|
| input_avg_dt | 0.008531 |
| roi_view_avg_dt | 0.005932 |
| detector_avg_dt | 0.703006 |
| tracker_avg_dt | 0.016689 |
| roi_events_avg_dt | 0.000503 |
| roi_events_writer_avg_dt | 0.000008 |
| tracker_annotator_avg_dt | 0.000296 |
| writer_avg_dt | 0.030035 |
[153]:
fig,axes = plt.subplots(1,1,figsize=(18,4))
metrics_df.plot.bar(ax=axes)
axes.set_title("Time spent in each component of the pipeline");
Exploration of results
Display the output video with annotated ROIs.
Note: currently XVID format is not supported by jupyter.
[135]:
%%HTML
<div style="text-align: center">
    <video width="600" height="400" controls>
      <source src="../data/output/test_output.avi" type="video/mp4">
    </video>
</div>
Events can be used as a starting point for counting objects, triggering alarms or to generate new variables with deeper insights.
[136]:
import pandas as pd

df = pd.read_csv(ROI_EVENTS_FILENAME)
df.head(10)
[136]:
| frame_num | event | obj_id | roi | |
|---|---|---|---|---|
| 0 | 2 | ENTERED | 1 | SCREEN |
| 1 | 2 | ENTERED | 2 | SCREEN |
| 2 | 2 | ENTERED | 3 | SCREEN |
| 3 | 2 | ENTERED | 2 | winch |
| 4 | 2 | ENTERED | 3 | winch |
| 5 | 233 | ENTERED | 1 | lower_right |
| 6 | 236 | LEFT | 1 | lower_right |
| 7 | 271 | ENTERED | 7 | SCREEN |
| 8 | 271 | ENTERED | 7 | winch |
| 9 | 358 | ENTERED | 1 | lower_left |
[137]:
df.tail(10)
[137]:
| frame_num | event | obj_id | roi | |
|---|---|---|---|---|
| 20 | 479 | ENTERED | 12 | SCREEN |
| 21 | 479 | ENTERED | 12 | winch |
| 22 | 648 | ENTERED | 13 | SCREEN |
| 23 | 648 | ENTERED | 13 | upper_right |
| 24 | 708 | ENTERED | 13 | lower_right |
| 25 | 719 | ENTERED | 16 | SCREEN |
| 26 | 719 | ENTERED | 16 | upper_right |
| 27 | 795 | ENTERED | 10 | lower_right |
| 28 | 796 | LEFT | 10 | lower_right |
| 29 | 827 | ENTERED | 17 | SCREEN |
[150]:
df.groupby(["event","roi"]).count()
[150]:
| frame_num | obj_id | ||
|---|---|---|---|
| event | roi | ||
| ENTERED | SCREEN | 10 | 10 |
| lower_left | 2 | 2 | |
| lower_right | 3 | 3 | |
| upper_left | 2 | 2 | |
| upper_right | 3 | 3 | |
| winch | 4 | 4 | |
| LEFT | lower_left | 2 | 2 |
| lower_right | 2 | 2 | |
| upper_left | 2 | 2 |